Quicklooks
Search by Granule
Search by Date
Latest 25 Quicklooks Reset Search
General Quicklooks Overview

CloudSat “quicklook” images are generated from the Level 0 Cloud Profiling Radar instrument data – that is, the data that are collected directly from the satellite without any calibration or other corrections being applied. These images are intended to provide a very rapid look at the performance of the instrument and, potentially, to provide a quick look (thus the name) at cloud systems that might be of interest to the general science community who might use the actual CPR data to do additional research. It is important for users to know that the quicklook images are views of raw data that have not been calibrated and, though infrequent, may contain errors in geolocation due to occasional orbit adjustments or other anomalies that might occur in the transmission of data through the global tracking and communications network. These images should not be used operationally and are placed here to provide an opportunity for meteorologists around the world to enjoy viewing these exciting new data. Most of the CloudSat quicklook images are displayed in the context of global infrared satellite imagery. These global data are a composite of geostationary imagery provided by the National Center for Environmental Prediction (NCEP) and AVHRR imagery provided by NOAA's Comprehensive Large Array-data Stewardship System (CLASS). In addition, some of the full resolution quicklook segments include corresponding MODIS imagery. MODIS swaths may contain geolocation shifts, missing data, or missing images and are only intended for context purposes.
Image Features (Satellite Data Overlay)

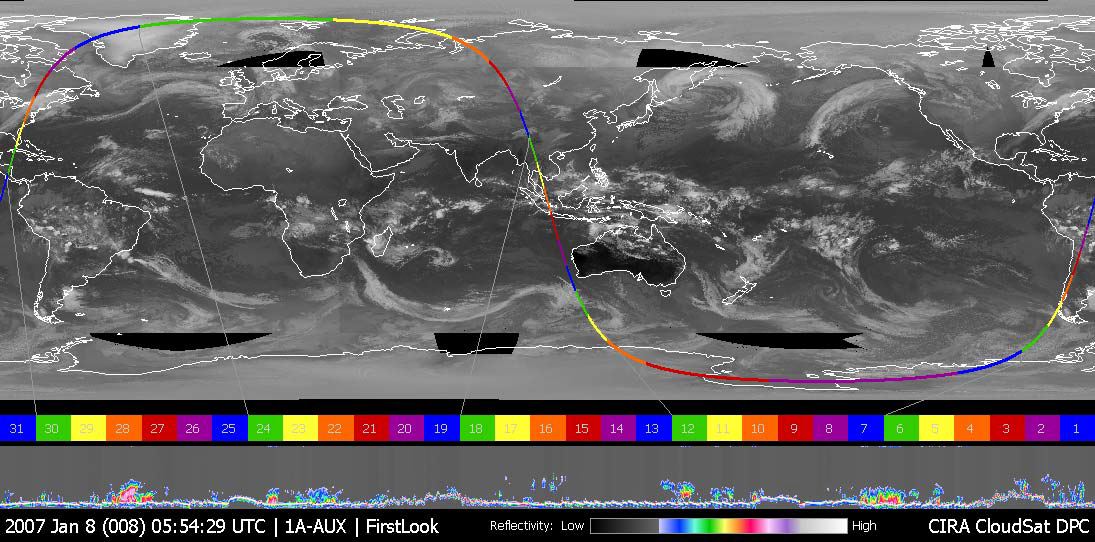
When you select the “Latest Quicklook Images” link, you will often see a display like the one shown below. In this display, global satellite imagery from both geostationary and polar orbiting satellites are displayed under the CloudSat orbit track. The satellite imagery is a combination of geostationary data provided by the National Center for Environmental Prediction (NCEP) and AVHRR (polar) imagery provided by NOAA's Comprehensive Large Array-data Stewardship System (CLASS).
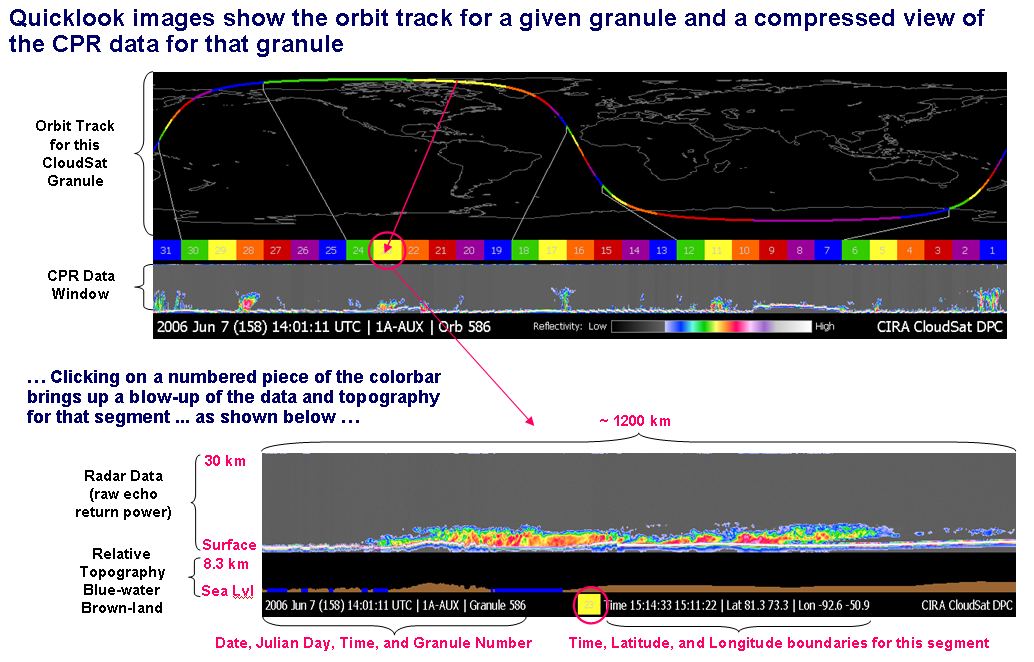
On the upper half of the image is a view of the CloudSat Orbit Track, shown in color-coded segments. Beneath that is a color bar with numbered segments that correspond to the colored orbit segments. Below the colorbar is the CloudSat “Data and Topography Window”. This window contains CloudSat data for an entire orbit (compressed to fit inside the window) and a display of the relative topography.
Radar Data Color Coding
CloudSat Radar data are displayed in the data window in colors that represent the intensity of the radar signal (called the “return echo power”). The colors are directly related to the “thickness” (water or ice content) of the cloud that the radar is detecting. The data window is shown as a dark gray background on which the radar data are displayed. The color bar is used to highlight the radar reflectivity from a very low value (thin clouds) to a high reflectivity (large water droplets, hail, or ground). The series of horizontal lines near the bottom of the data window represents the strong reflective signal from the earth surface. This “ground return” can be a variety of colors, most often white, and should follow the terrain elevation (see the “Orbit Segment” description below). Because some ground surfaces are very rough, the signal is “scattered” and the amount of energy going back to the spacecraft is not as great … so the color of the ground return can be represented by any of the colors in the table.
Orbit Segments

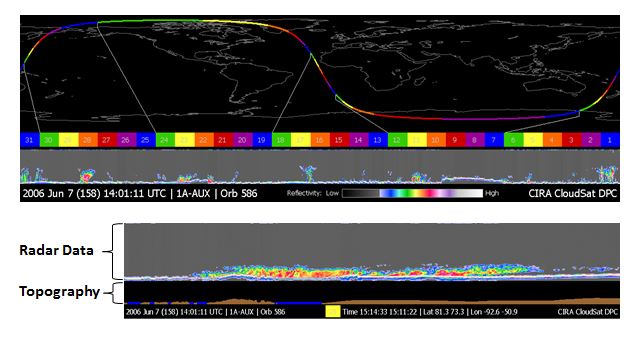
To view a higher resolution display of each segment (and a better view of the topographic window), simply click on one of the colors on the horizontal colorbar (not on the orbit segment) and the data for that segment will be displayed. We will look at segment 23 (circled in white below) to see the image that is displayed when that yellow segment is selected.
Above is an example of the data that are displayed when segment 23 (see white circle above) is selected. Here you can now see the topographic data below the CPR data in the segment window. The topographic window shows whether CloudSat is flying over land (brown) or water (blue). Each orbit segment is 1196 pixels wide, with each pixel representing one CloudSat sample (called a “profile”). A CloudSat profile is generated every 1.1 km along the orbit track, so this segment represents a distance of 1315 km which is ~817 miles. (There are approximately 37088 profiles in a CloudSat orbit – which is broken into 31 segments … so several segments will contain 1197 profiles)
NOTE: The height of the brown land plot corresponds to the relative height of the surface. Land elevation is plotted in meters with the highest point on earth being Mt. Everest which is 8850m tall (if we fly over this point the brown will extend to near the top of the topographic window. Also note that the water is plotted as a thicker blue line to make it easy to see and that line does not represent the height of the water – so lakes at high altitude will be displayed the same as sea level oceans.
Time and Location
On the data bar at the bottom of each segment is the year, month, and day (Julian day) UTC time, product type, segment number, and the start and stop time of the segment and the start and stop latitude and longitude of the segment. Each profile (one horizontal pixel) represents 160 milliseconds of time and 1.1 km of distance.
NOTE: the CloudSat data will always follow the direction of the orbit … so the scan will move from right to left in time. For the example shown, the time of the profile at the right edge of the segment was 15:11:22 UTC (15 hours, 11 minutes, 22 seconds).
FirstLook vs. Standard Level 0 Products
The “First Look” images (annotated, simply, “First Look”) are built with raw GPS data from the engineering data stream. Once per day, around 16:00 UTC, the Standard Level 0 images are built using a “Definitive Ephemeris” that will include maneuvers that occurred on the previous Julian day. These files will be renamed to include a “granule number” and will replace the “First Look” images. Because CloudSat granules begin on the descending node and orbit numbers for a satellite increment on the ascending node, the granule number will match the CloudSat orbit number for the first half of the granule and then the granule number will be one less than the orbit number for the second half of the granule.


