Warm rain rates inferred from AMSR/E & AMSR/2 89 GHz passive microwave brightness temperatures trained using CloudSat rain rate observations
Ryan Eastman, Matthew Lebsock, Robert Wood
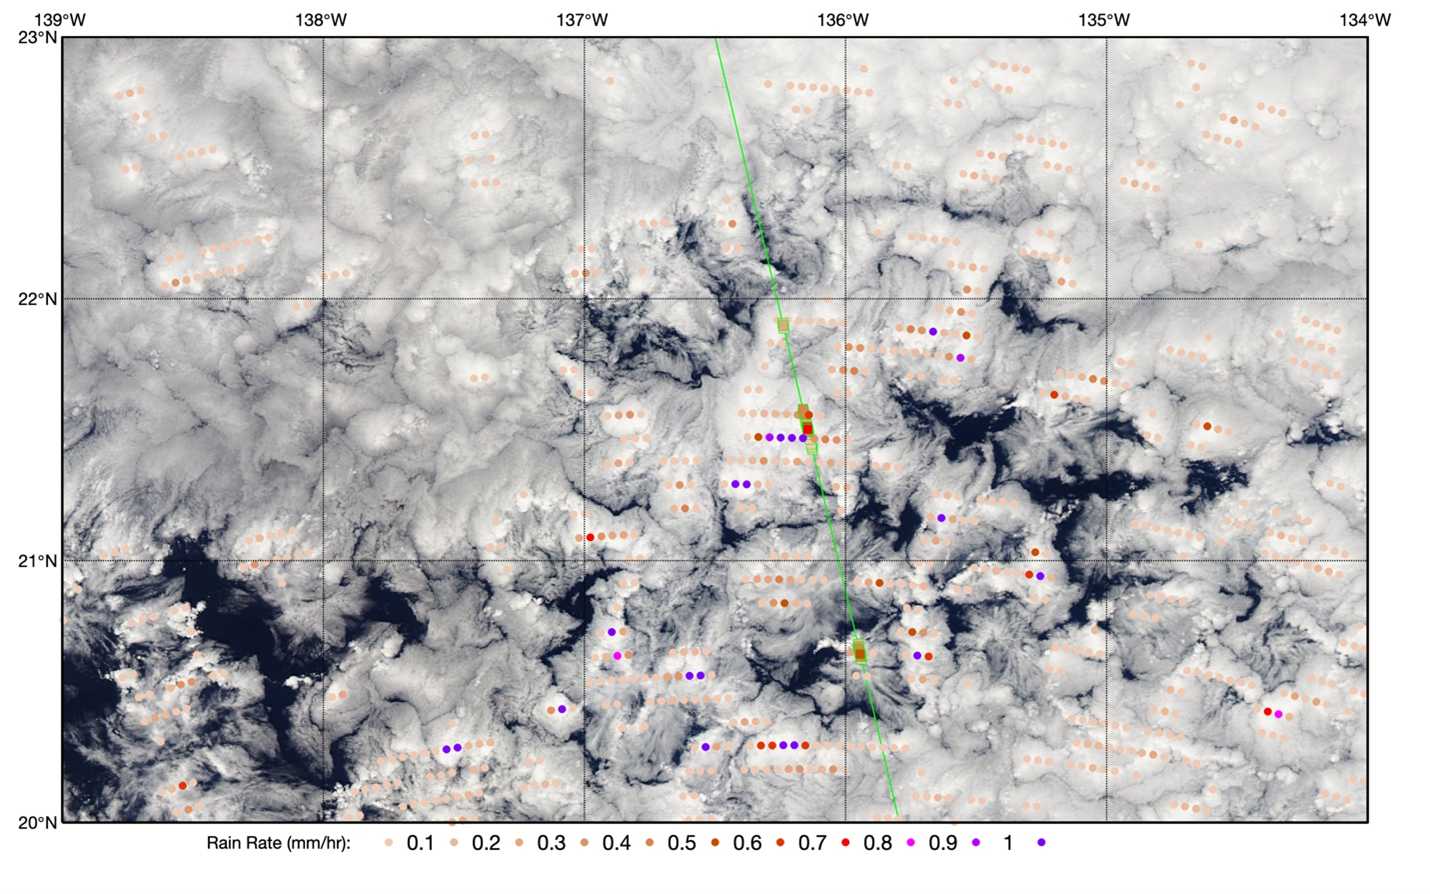
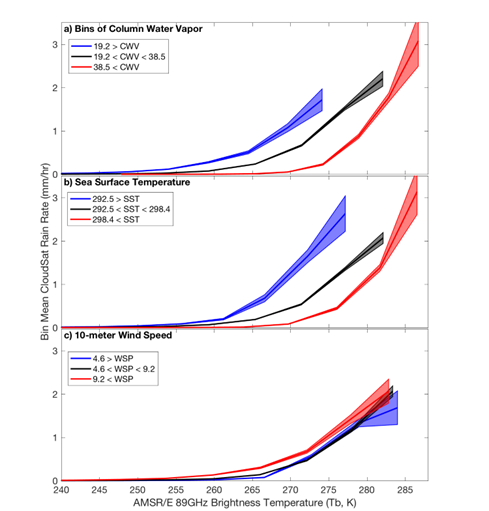
Rain rate estimates are inferred from brightness temperature (Tb) as sensed by the AMSR/E and AMSR/2 89 GHz passive microwave sensors. Warm Tb is associated with more intense rain rates, a warmer sea surface, modified surface winds, and increased atmospheric water vapor. A training algorithm is developed and applied here: rain rates, as quantified by the CloudSat rain-profile product, are compared against co-located AMSR/E Tb values within ~4x6 km pixels. Comparisons are done within bins of constant wind speed and sea surface (from ERA5 reanalysis) and within bins of constant column integrated water vapor (from AMSR/E). Within each bin, a power law curve is fit to the rain rate-Tb relationship, and this power law is then applied to all Tb values across the AMSR swath for each bin, producing rain rate estimates for all available Tb values equatorward of 50° N and S. The probability of rainfall is inferred from Tb values via a logit curve.
Figures from Eastman et al. (2019)
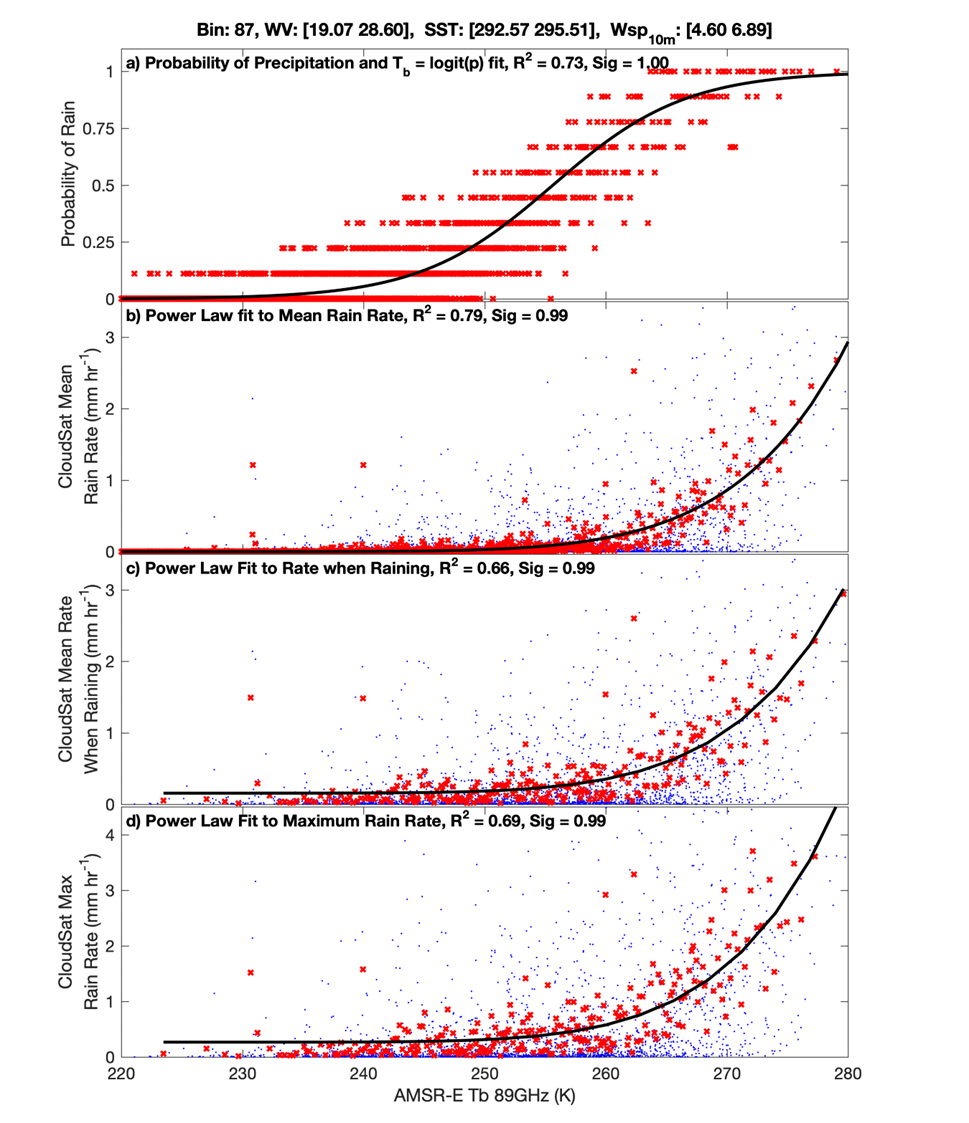
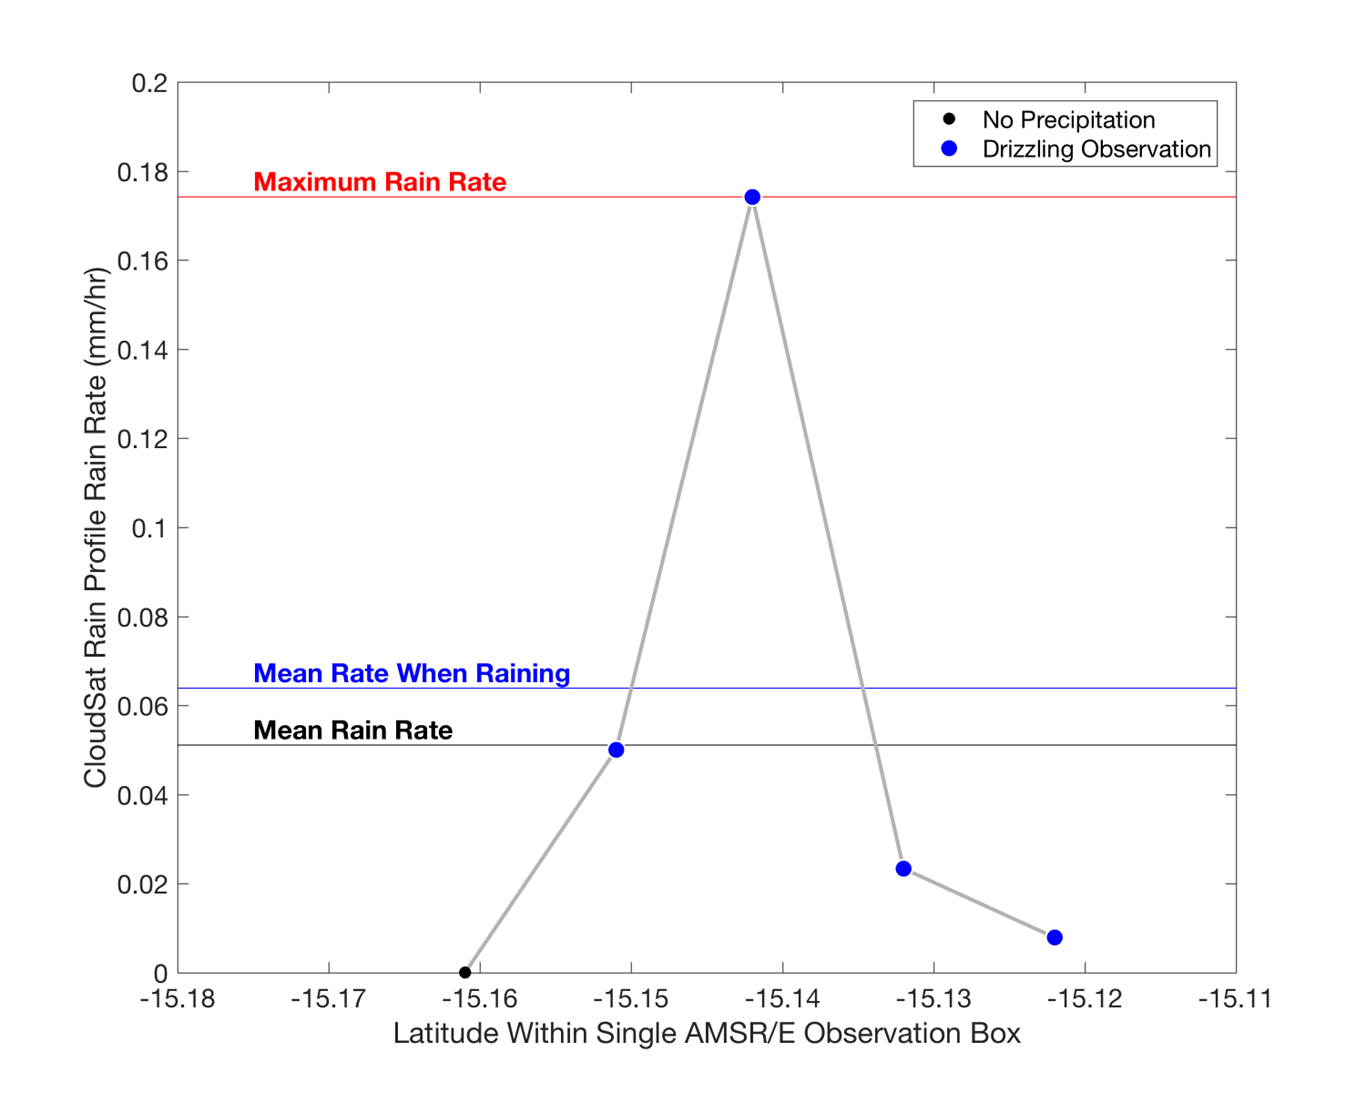
Four data products are available for the 89 GHz Tb values observed at each pixel center. These include: 1) Probability of precipitation based on how frequently CloudSat senses rain for a given Tb within a given bin, 2) The mean rain rate observed by CloudSat for that Tb value and bin, 3) The mean rain rate when raining for all raining CloudSat observations for a given Tb value and bin, and 4) the maximum rain rate seen by CloudSat for a Tb value. Products 3 and 4 are produced to better characterize the distribution of rain rates seen for a given Tb. Occasionally, a Tb value exceeds the highest seen in our training data, making the rain statistic associated with that Tb uncertain, and so it is assigned the maximum value for that product observed within that bin and flagged with a negative sign.
The presence of overlying ice clouds is tested for, and regions with an above-threshold amount of cold cloud are excluded from the training and from the final product.
Bins where our training dataset lacked enough data to produce a robust power law fit are also excluded from the product.
The relationship between CloudSat rain rates and AMSR Tb is assumed to be equivalent for AMSR/E and AMSR/2.
Data are available in daily files for day and night separately for years 2003-2021.
The larger AMSR/2 data files are split into western and eastern hemisphere portions in order to keep file sizes manageable.
File sizes are ~338 Mb per daily hemispheric AMSR/2 files, and ~400 Mb per daily global AMSR/E files.
Data are stored in vector format at the swath level, with values at each pixel center.
Pixel sizes for AMSR/E are ~4x6 km, with scans spaced 10 km apart in the along-track direction and 5 km apart in the across-track direction, with 486 pixels available across the arc-shaped scan.
Pixel sizes for AMSR/2 are ~3x5 km, with scans spaced 10 km apart in the along-track direction and 5 km apart in the across-track direction, again providing 486 pixels per arc-shaped scan.
There are two 89 GHz scans available for AMSR/2 (overlapping A and B scans are both used here), which roughly doubles the data resolution in the along-track direction.
Observation times are for approximately 0130 and 1330 local times, matching A-Train equator crossing times.