Arctic Observation and Reanalysis Integrated System
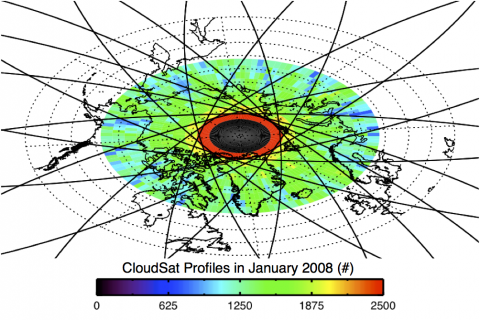
Number of CloudSat profiles binned into 2.5° × 2.5° regions using January 2008 observations over 60°N – 90°N.
Black lines are individual orbits made by CloudSat for one day of observations.
The Arctic Observation and Reanalysis Integrated System is a merged database containing a suite of satellite, reanalysis, and in situ products.
The products are utilized to construct a comprehensive dataset for the community to study multiple, and often complex, processes and interactions over the arctic region.
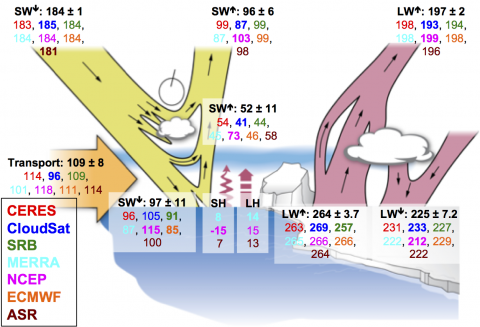
With the dramatic decline in sea ice and snow extent in previous years it is essential to characterize the surface energy budget to gain a better understanding of how Arctic amplification of temperature may manifest in the future.
Satellite and reanalysis products are matched together in the integrated product using a common spatial resolution of 2.5°×2.5° and monthly averaging timescale.
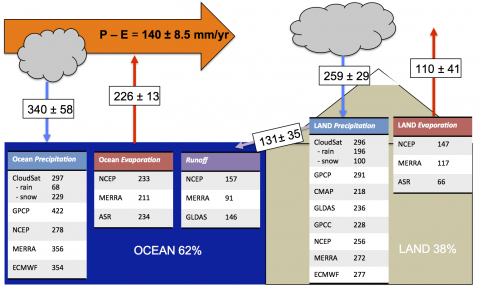
Primary variables include state-of-the art satellite retrieved cloud properties, radiation fluxes (top and bottom of atmosphere), surface precipitation rates, and snow and sea ice extents.
Corresponding quantities are also provided from several reanalysis products.
The dataset is geared for scientific inquiry, product validation, and assessment of the radiation and moisture budgets in the Arctic.
The majority of the data products used to construct this integrated dataset have been developed and published in peer-review journals.
We encourage users of this data to familiarize themselves with pertinent documentation provided by each data product contained here.
Below is a short list of the merged highlighted products.
Satellites
Reanalysis
AIRS
ARS
CERES
ECMWF-INTERIM
CloudSat
MERRA
GEWEX-SRB
NCEP
GRACE
MACC
NSIDC
CMAP
GPCP
Product Image Examples
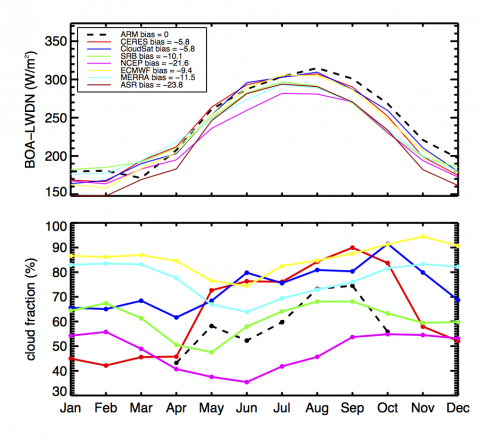
Monthly mean (a) surface downwelling longwave radiation (BOA-LWDN) and (b) all-sky cloud fraction averaged over the period between 2007 and 2010.
ARM measurements (dashed black line) are obtained from Barrow Alaska on the North Slope (71.3° N, 156.6° W). Cloud fraction was measured from the ARM site using the all-sky imager.
CERES (red), CloudSat (blue), GEWEX-SRB (green), NCEP (pink), ECMWF (yellow), MERRA (teal), and ASR (maroon) products are matched to the nearest 2.5° region.
Error bars were determined from the standard deviation taken from the population of ARM site observations.
Error bars extend one standard deviation above and below the mean for each bin.
Number of CloudSat profiles binned into 2.5° × 2.5° regions using January 2008 observations over 60°N – 90°N.
Black lines are individual orbits made by CloudSat for one day of observations.
Number of CloudSat profiles binned into 2.5° × 2.5° regions using January 2008 observations over 60°N – 90°N.
Black lines are individual orbits made by CloudSat for one day of observations.
Number of CloudSat profiles binned into 2.5° × 2.5° regions using January 2008 observations over 60°N – 90°N.
Black lines are individual orbits made by CloudSat for one day of observations.
Number of CloudSat profiles binned into 2.5° × 2.5° regions using January 2008 observations over 60°N – 90°N.
Black lines are individual orbits made by CloudSat for one day of observations.
Number of CloudSat profiles binned into 2.5° × 2.5° regions using January 2008 observations over 60°N – 90°N.
Black lines are individual orbits made by CloudSat for one day of observations.